Close Menu
Daily ForexDaily Forex
  • Home
  • Broker Comparison
  • Market Rates
  • Market Updates
  • News
  • About us
  • Contact us
  • List your Broker
  • Advertise with us

Subscribe to Updates

Get the latest creative news from FooBar about art, design and business.

What's Hot

Japanese Yen Steady Amid Mixed Economic Signals – USD/JPY Faces Downside Risk

June 27, 2025

Divergences Are Not Trade Signals—Use Them Wisely

June 27, 2025

EUR/USD Holds Firm Near 1.1700 as Fed Independence Worries Weigh on Dollar

June 27, 2025
Facebook X (Twitter) Instagram
  • About Us
  • Contact Us
  • List Your Broker
  • Advertise with Us
  • Economic Calendar
Facebook X (Twitter) Instagram YouTube Telegram
Daily ForexDaily Forex
Demo
  • Home
  • Broker Reviews
  • Learn Forex
  • Learn Crypto
  • Market Rate
  • Market Updates
  • News
Daily ForexDaily Forex
Home » Gold Market Analysis for February 10 – Key Intraday Price Levels for Active Traders
Market Updates

Gold Market Analysis for February 10 – Key Intraday Price Levels for Active Traders

By Hamza ShahFebruary 10, 2025Updated:February 13, 2025No Comments2 Mins Read14 Views
Facebook Twitter Pinterest LinkedIn Telegram Tumblr Email
Share
Facebook Twitter LinkedIn Pinterest Email

Gold Market Analysis for February 10 – Key Intraday Price Levels for Active Traders

Gold prices are experiencing short-term volatility, creating opportunities for intraday traders. If you aim to capitalize on market fluctuations, it is crucial to monitor key technical support and resistance levels.

At DailyForex.pk, we provide real-time market analysis to help gold traders make informed decisions. Let’s explore the key buy and sell levels for February 10.


📉 Key Intraday Gold Market Levels

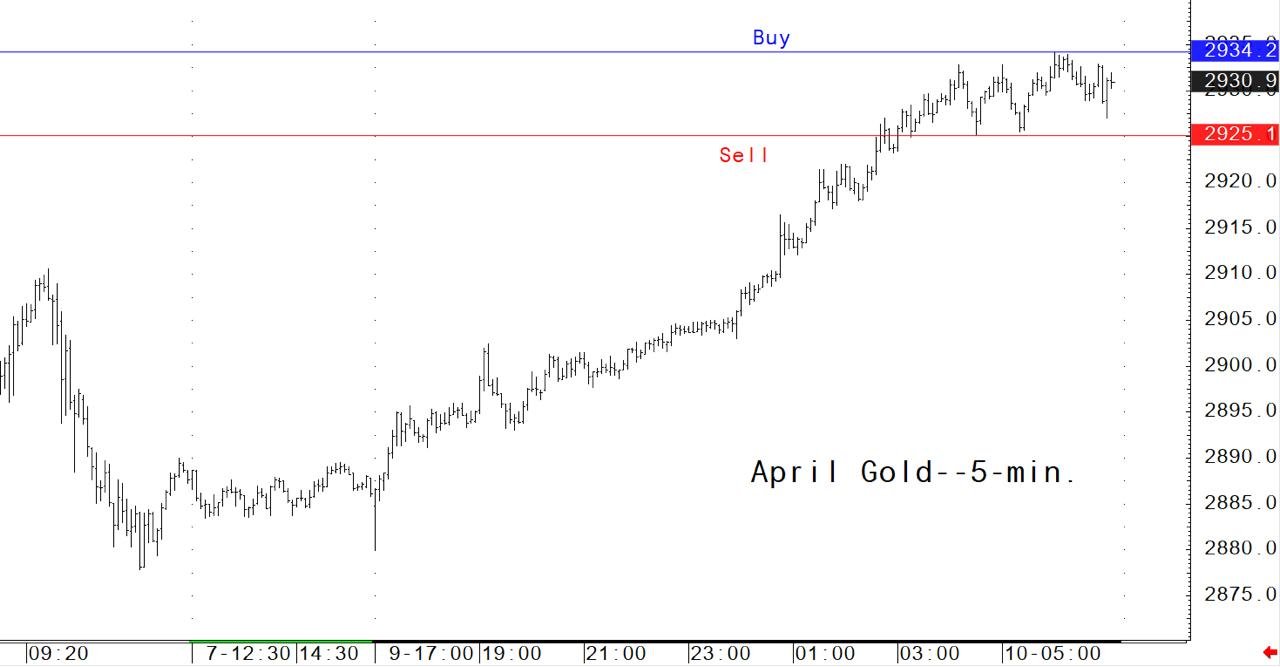
Using the 5-minute COMEX gold futures chart, we identify crucial price levels where significant market activity is expected. Traders should closely monitor these levels to take advantage of potential breakouts or pullbacks.

🔹 Key Resistance Levels (Selling Opportunities)

  • $2,055 – $2,060 – Strong intraday resistance; failure to break above this level could present short-selling opportunities.
  • $2,070 – A psychological barrier; rejection at this level may indicate further downside movement.
  • $2,085+ – A breakout above this level could signal bullish momentum, potentially leading to higher price levels.

🔹 Key Support Levels (Buying Opportunities)

  • $2,040 – $2,045 – Initial support zone; if the price holds, it could present a buying opportunity.
  • $2,030 – A stronger support level; holding this level could sustain the bullish trend.
  • $2,015 – $2,020 – Major support zone; if gold drops to this level, watch for a potential reversal pattern.

📌 Trading Tip: Successful traders typically buy on early strength and sell on early weakness to maximize profits.


📊 Gold Market Trends & Analysis

🔸 Short-Term Trend: Gold is in a sideways consolidation phase, and market data suggests a possible breakout or breakdown.
🔸 Key Market Drivers: U.S. inflation data, Federal Reserve policies, and geopolitical risks can significantly impact gold prices.
🔸 Technical Indicators: RSI and Moving Averages indicate mild bullish momentum, but key levels need to be monitored for confirmation.


💡 Benefits of Gold Trading with DailyForex.pk

🔹 Daily Expert Analysis – Get updates on intraday support and resistance levels.
🔹 Real-Time Price Updates – Access live gold market data for precise decision-making.
🔹 Pro Trading Insights – Identify optimal entry and exit points for profitable trades.

🚀 Enhance your forex and gold trading today! Visit: DailyForex.pk for expert market insights!

Share. Facebook Twitter Pinterest LinkedIn Tumblr Email

Related Posts

Japanese Yen Steady Amid Mixed Economic Signals – USD/JPY Faces Downside Risk

June 27, 2025

EUR/USD Holds Firm Near 1.1700 as Fed Independence Worries Weigh on Dollar

June 27, 2025

Crypto Market Outlook – June 27, 2025: Bitcoin Rebounds, Ethereum Activity Climbs, Pi Network Faces Pressure

June 27, 2025

Gold and Silver Outlook Steady as Traders Await Key US PCE Inflation Data

June 27, 2025

Japanese Yen and Australian Dollar Outlook: Inflation and China’s Industrial Data Drive Market Moves

June 27, 2025

US Dollar Drops to Multi-Year Lows: What It Means for Gold, Silver, and Market Sentiment

June 27, 2025
Leave A Reply Cancel Reply

Top Posts

Should Forex Traders Use Brokers Offering Deposit Bonuses? Is It Really Worth It?

March 6, 20252,715 Views

Pakistan Confident in IMF Bailout Review as Economic Stability Gains Momentum

March 4, 20252,651 Views

Gold Price in Pakistan Today – March 7, 2025 (Morning Update)

March 7, 20252,640 Views
Don't Miss

Japanese Yen Steady Amid Mixed Economic Signals – USD/JPY Faces Downside Risk

June 27, 2025

The Japanese Yen remains stable amid mixed economic indicators, while USD/JPY shows signs of downside risk.

Divergences Are Not Trade Signals—Use Them Wisely

June 27, 2025

EUR/USD Holds Firm Near 1.1700 as Fed Independence Worries Weigh on Dollar

June 27, 2025

Crypto Market Outlook – June 27, 2025: Bitcoin Rebounds, Ethereum Activity Climbs, Pi Network Faces Pressure

June 27, 2025
Stay In Touch
  • Facebook
  • YouTube
  • TikTok
  • WhatsApp
  • Twitter
  • Instagram
Latest Reviews
Daily Forex
Facebook X (Twitter) YouTube
  • Home
  • Privacy Policy
  • Terms of use
  • Disclaimer
  • Feedback
Copyright © 2025 DailyForex.pk. All Rights Reserved.

Type above and press Enter to search. Press Esc to cancel.