Highlights and key points
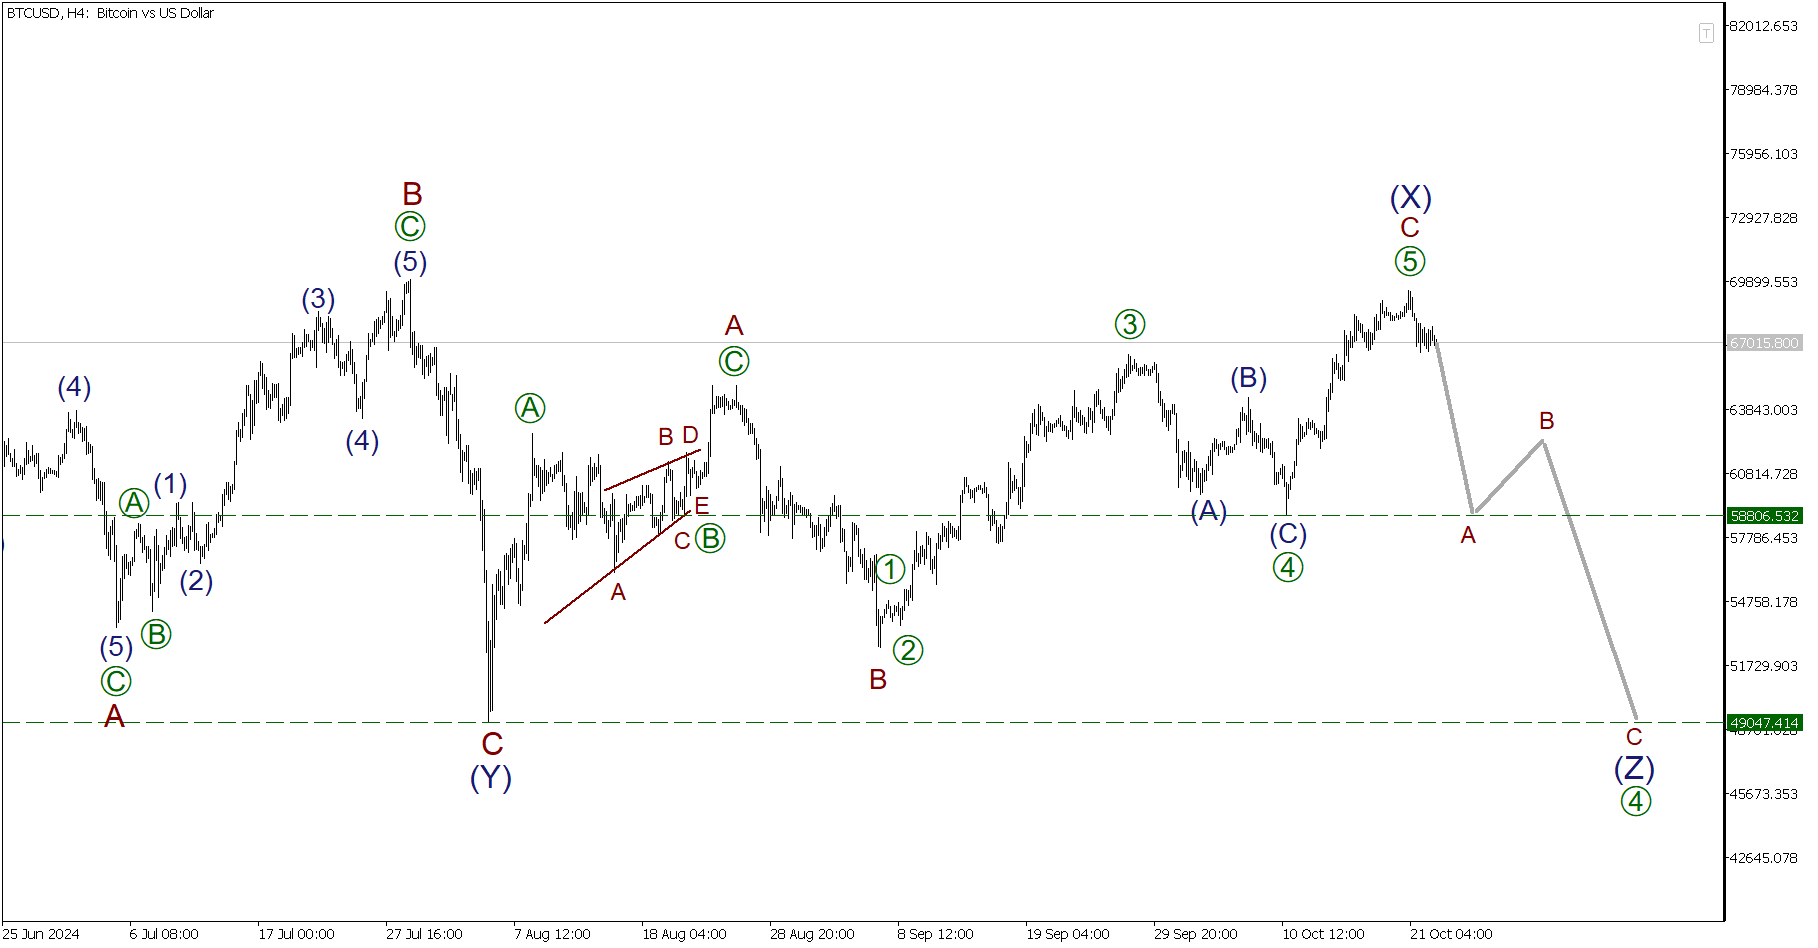
- BTCUSD: a horizontal correction is completed, and a bearish trend has begun developing. Consider opening short positions from the current levels with Take Profit at 58,806.53.
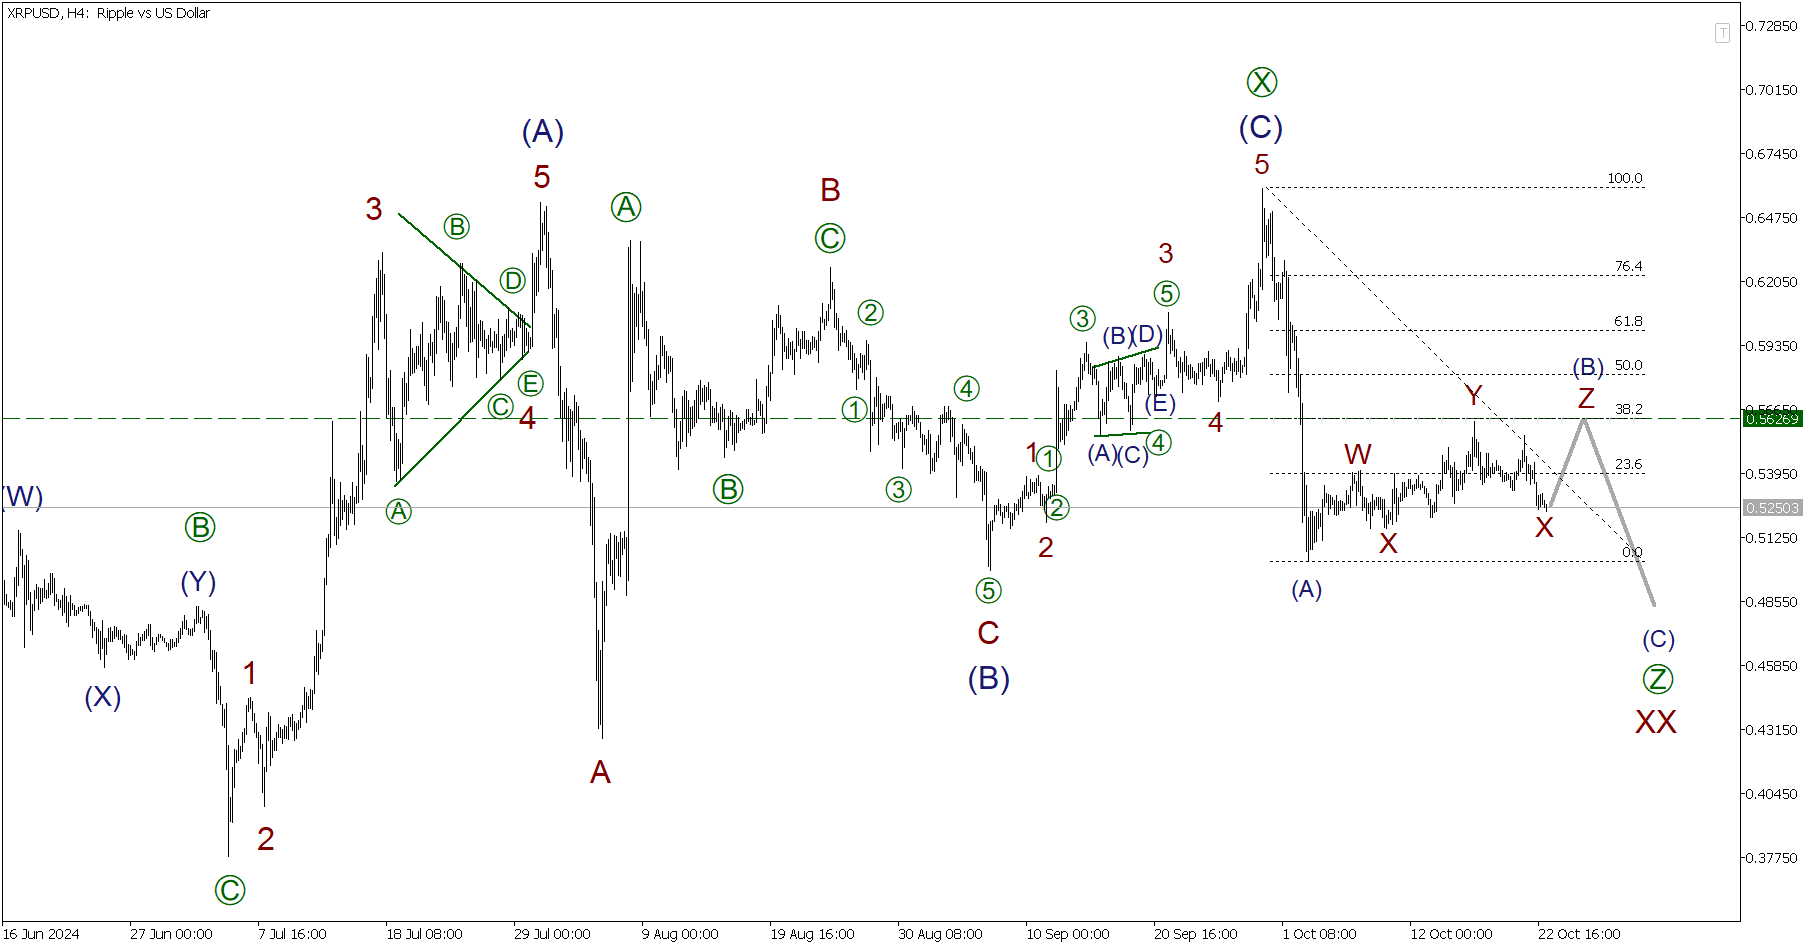
- XRPUSD: a correction is expected to end near 0.562. Consider long positions with Take Profit at 0.562.
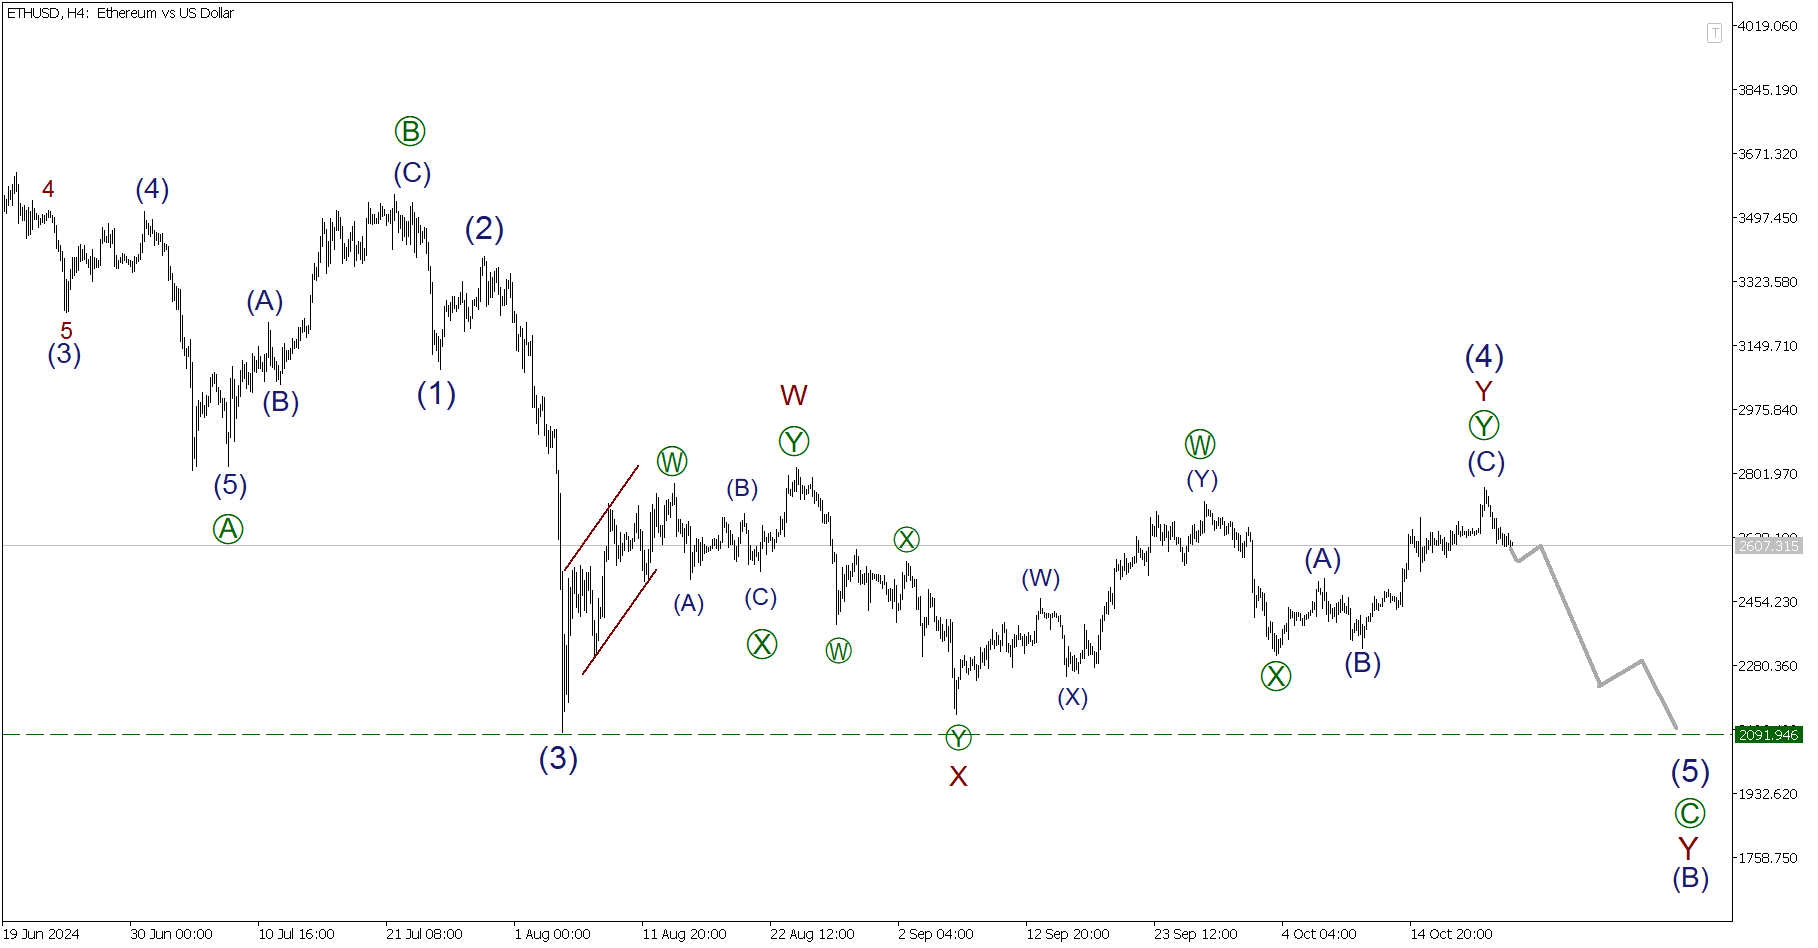
- ETHUSD: a bearish impulse may end near the previous low. Consider selling from the current level with Take Profit at 2,091.94.
Elliott Wave Analysis for Bitcoin

The BTCUSD is expected to form a large corrective trend in the form of a triple zigzag (W)-(X)-(Y)-(X)-(Z). Its second linking wave (X) is presumably completed as a horizontal flat A-B-C. The pair is declining in the last segment of the chart, potentially confirming that the final actionary wave (Z) has started unfolding. Wave (Z) will likely develop as a regular zigzag A-B-C. The first impulse wave is expected to end near a low of 58,806.53.
Trading plan for BTCUSD for today:
Sell 67,015.80, Take profit: 58,806.53
Elliott Wave Analysis for Ripple

In the medium term, the XRPUSD pair appears to be building a linking wave XX as a triple zigzag [W]-[X]-[Y]-[X]-[Z]. Its zigzag-shaped linking wave [X] has already formed, and the first part of the actionary wave [Z] is currently unfolding. It may become a simple zigzag (A)-(B)-(C), as shown in the chart. Bearish impulse wave (A) is likely completed, and correction (B) may form shortly as a triple zigzag W-X-Y-X-Z. Its last subwave Z may end near a level of 0.562, where correction (B) will equal 38.2% of impulse (A) according to Fibonacci lines. Consider long positions.
Trading plan for XRPUSD for today:
Buy 0.525, Take profit: 0.562
Elliott Wave Analysis for Ethereum

Ethereum‘s chart shows a breakdown of a bearish impulse wave [C] of (B). The first three parts of impulse [C] are fully formed. Corrective wave (4) is likely completed as a double zigzag W-X-Y. A new bearish wave (5) is currently unfolding, presumably as an impulse, as shown in the chart. The price will likely drop to a low of 2,091.94, marked by impulse (3).
Trading plan for ETHUSD for today:
Sell 2,607.31, Take profit: 2,091.94


