When forecasting the EURJPY exchange rate in the coming days and weeks, monitor key economic indicators and policy decisions from the European Central Bank and the Bank of Japan. Look for data on inflation, GDP growth, and employment rates from both countries. Political events in Europe and Japan, as well as global geopolitical developments, can also affect the currency pair. Additionally, use technical analysis tools such as Moving Averages, the RSI, and MACD to identify trends and potential reversals in the exchange rate.
EURJPY Forecast for 2024 – Expert Predictions
Let’s review EURJPY’s expert forecasts for 2024. Most analysts expect the uptrend to continue.
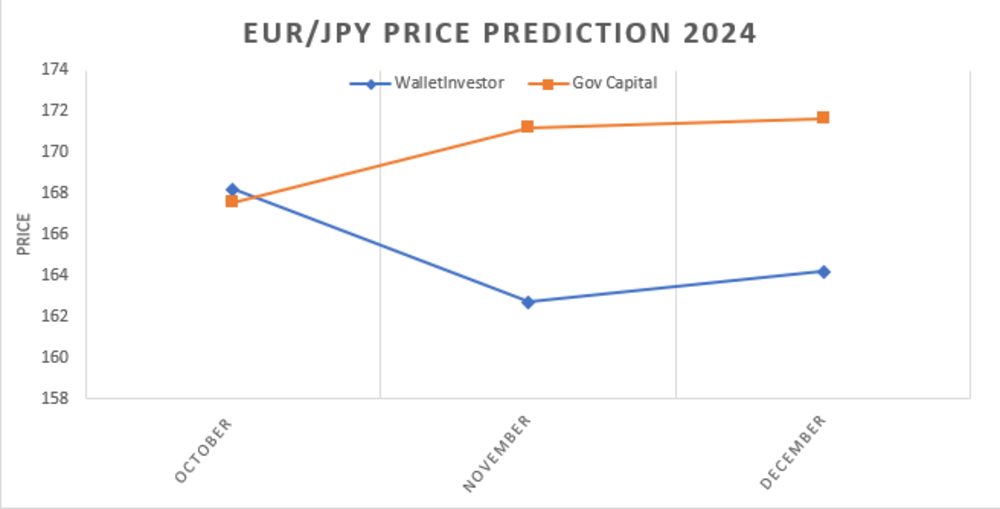
WalletInvestor
Price range: ¥161.623 – ¥164.169 (as of 26.09.2024).
WalletInvestor forecasts a positive outlook for the EURJPY pair, with consistent growth anticipated at the end of the year.
| Month | Open, ¥ | Close, ¥ | Minimum,¥ | Maximum, ¥ | Change |
|---|---|---|---|---|---|
| November | 161.623 | 162.711 | 161.623 | 162.711 | 0.67 % ▲ |
| December | 162.741 | 164.113 | 162.741 | 164.169 | 0.84 % ▲ |
Gov Capital
Price range: ¥155,85 – ¥171,63 (as of 26.09.2024).
Gov Capital experts predict a solid growth towards 171.63, making the EURJPY pair a promising investment.

EURJPY Technical Analysis
Technical analysis of the EURJPY pair involves using various time frames and tools to identify trends and potential pivot points. It is advisable to assess the overall trend on higher time frames, such as weekly and monthly, using the RSI, MACD, and Stochastic indicators.
- MACD helps to identify pivot points, especially on higher time frames.
- RSI (14) is used to identify the overbought and oversold zones and potential pivot points.
- Stochastic helps assess the overbought and oversold conditions.
“Head and shoulders,” “Double Bottom,” “Flag” chart patterns, and candlestick formations can signal potential reversals or trend continuation. It is important to combine indicators and patterns with support and resistance levels for more accurate analysis.


