What is a Rising Wedge?
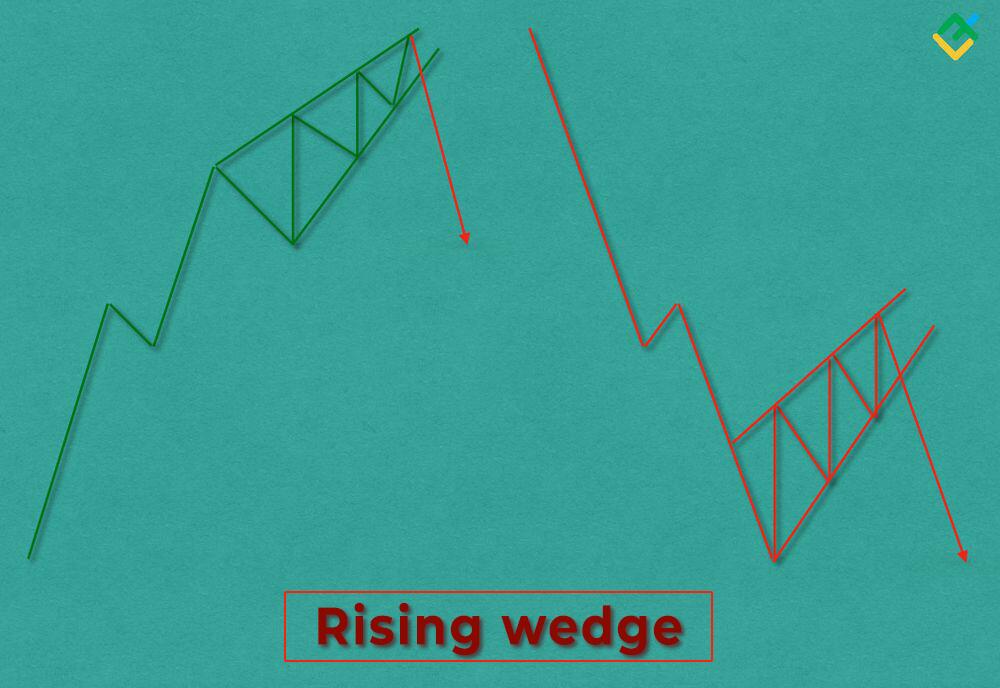
A “Rising wedge” pattern is commonly known as a bearish technical analysis chart pattern that forms at the highs during an uptrend or in the middle of a downtrend and signals a bearish price reversal.
Experienced traders can quickly spot the pattern on the chart. It is a narrowing price formation in an ascending channel, characterized by higher lows and higher highs.
Notably, the diagonal support line in the pattern is steeper compared to the resistance line. This signals the gradual exhaustion of bulls and the growing pressure on the price from the sellers.
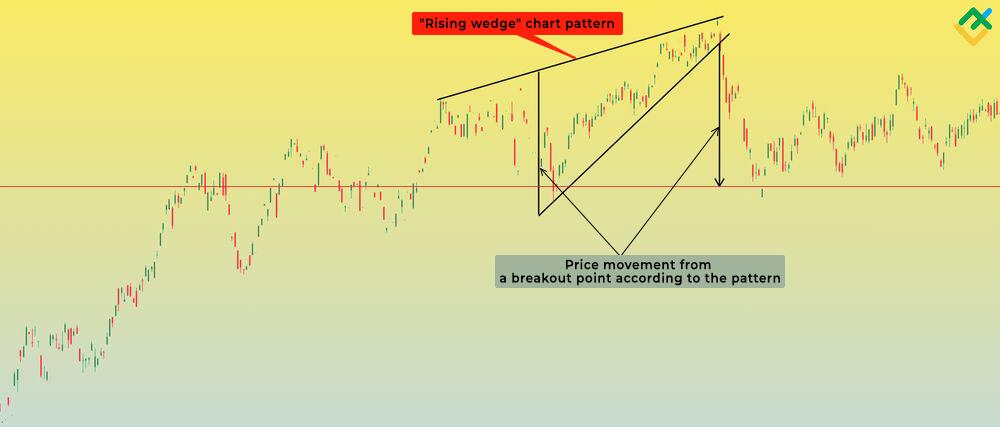
The narrowing of the wedge at the peak implies further breaching of the diagonal support line, indicating a bearish trend reversal. Once the price breaks through the pattern from above, short trades can be opened.
After a breakout to the downside, the price may reverse to test the support level. A rebound from the support line usually confirms the presence of a “Rising wedge” pattern.
However, a support breakout usually occurs impulsively without confirmation when trading volumes are high. Therefore, it is advisable to look for an entry into a short trade on lower time frames to avoid missing on a position.

What Do Rising Wedges Look Like?
A “Rising wedge” pattern is a large price formation appearing on higher time frames.
The pattern formation at the end of an uptrend or in the middle of a downtrend follows this sequence:
- The price steadily increases within the converging diagonal lines of support and resistance while the volumes are low. The lower trend line has a steeper slope.
- Over time, support and resistance levels converge, creating a wedge shape.
- As the pattern develops, the price lows and highs increase. The trading range between these points gradually shrinks.
- Trading volumes usually decrease during a “Rising wedge” formation and rise when the pattern is pierced.
- The price breaks through the trend line from above at the peak of the pattern, signaling a price reversal and creating selling opportunities.
A “Rising wedge” pattern reveals the growing tension in the market and suggests a potential trend reversal.

What Causes Rising Wedges?
A “Rising wedge” pattern reflects the supply and demand changes in the market and is influenced by the following factors:
- Supply growth. When the pattern forms, sellers become active in the market. Bulls lock in the profit on long trades and open short trades, leading to a rapid increase in supply. Although buyers still dominate the market, a “Rising wedge” indicates a gradual waning of their strength.
- As the pattern forms, the demand for the asset gradually decreases, leading to a slowdown in price growth despite aggressive purchases.
- Historical and swing resistance levels. As a rule, a “Rising wedge” pattern develops at historical or swing highs, where a lot of short trades were previously initiated.
- Fundamental and psychological factors. When detecting a “Rising wedge” pattern on the price chart, it is important to study the fundamental factors affecting the asset’s value. Sometimes, after the pattern formation, the price starts to grow instead of falling, driven by positive news. Additionally, the more market participants identify the pattern on the chart, the stronger the downward movement will be.
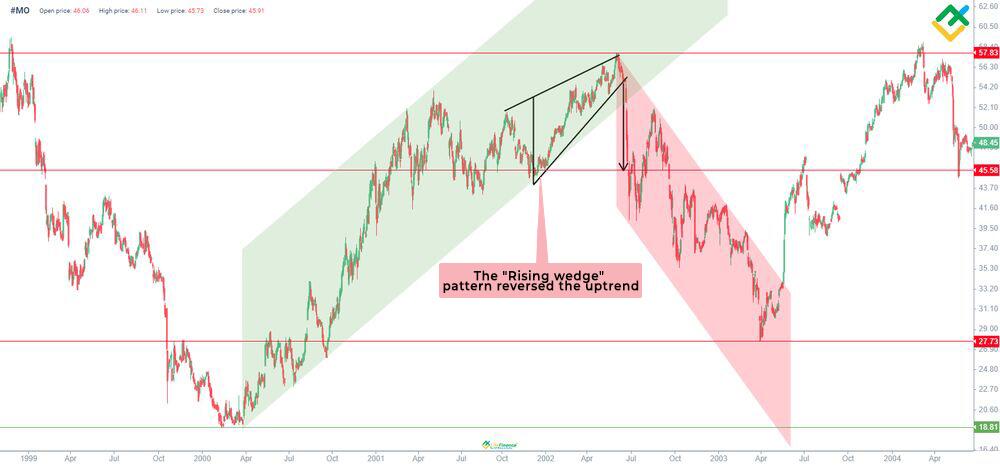
Review an example of a “Rising wedge” pattern’s influence on the trend change on the Altria Group Inc. chart below.

During a downtrend, the rising wedge pattern often indicates a continuation of the trend. An illustration of this pattern is demonstrated below on the 4-hour chart of Starbucks Corporation shares.


