efinition and Understanding of the Advance/Decline Line
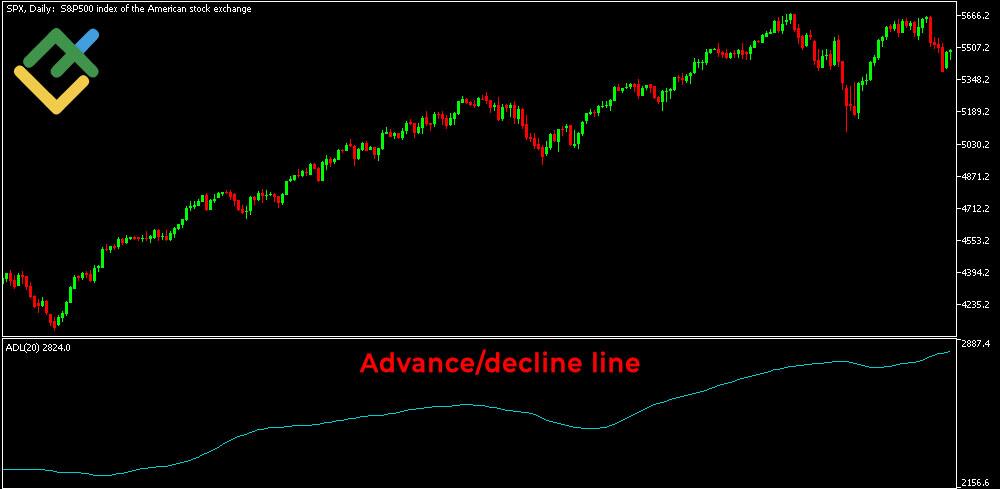
The advance/decline line is a technical indicator that plots the difference between the number of advancing stocks and declining stocks in an index on a daily basis, providing valuable data on the breadth of the market. This A/D line indicator assesses the overall market health and shows how widespread market movements are and whether stocks are participating in a trend. The A/D line is particularly useful when analyzing capitalization-weighted indices, such as the S&P 500, as it helps determine the strength of price movements and evaluate the stability of the trend.

History of the Advance/Decline Line
The Advance Decline Line was first introduced in the 1930s to perform research analysis of the New York Stock Exchange (NYSE). In the 1960s, Richard Russell made this indicator widely known by including it in his renowned “Dow Theory Letters.” Russell demonstrated how the A/D line helped determine the market’s strength and health and confirm existing trends. Since then, it has become a crucial technical analysis tool to assess market trends in various stock markets, including NASDAQ, FDAX, and others.
Formula and Calculation of the Advance/Decline Line
You can calculate the A/D line by following the steps described below.
1. Determine the number of ascending stocks and declining stocks on a daily basis.
2. Calculate Net Advances.
Use the formula:
Net Advances = Number of daily ascending stocks − Number of daily descending stocks
Here you should subtract the number of stocks that finished lower on the day from the number of stocks that finished higher on the day. The result shows the Net Advances, the difference between rising stocks and those that have dropped in value.
3. Write down the value of the previous day’s A/D line. It will be used to calculate the current indicator value.
4. Calculate the current A/D line value using the following formula:

Here you should add the Net Advances to the Previous Advances.
5. Example:
If there are 450 ascending stocks and 350 declining stocks during the day, the net advances will be 100 (450-350). If the previous day’s A/D line value was 1,200, the new value will be: 1,200 + 100 = 1,300.
This calculation is done daily to track changes in the market trend. This cumulative calculation creates a line that represents the market breadth.
Practical Example
Suppose the following changes occurred in the S&P 500 Index over a five-day period:
| Day | Number of Advancing Stocks | Number of Declining Stocks | Net Advance | A/D Line |
| 1 | 300 | 200 | 100 | 100 |
| 2 | 250 | 300 | -50 | 50 |
| 3 | 350 | 150 | 200 | 250 |
| 4 | 400 | 100 | 300 | 550 |
| 5 | 200 | 300 | -100 | 450 |
- Day 1: 300 advancing stocks and 200 declining stocks, Net Advance = 100. Initial A/D Line value = 100.
- Day 2: 250 advancing stocks and 300 declining stocks, Net Advance = -50. A/D Line value = 100 (previous) + (-50) = 50.
- Day 3: 350 advancing stocks and 150 declining stocks, Net Advance = 200. A/D Line value = 50 (previous) + 200 = 250.
- Day 4: 400 advancing stocks and 100 declining stocks, Net Advance = 300. A/D Line value = 250 (previous) + 300 = 550.
- Day 5: 200 advancing stocks and 300 declining stocks, Net Advance = -100. A/D Line value = 550 (previous) + (-100) = 450.
This ADL calculation shows how the advance-decline line changes depending on the daily data on rising and falling stocks. Investors use this data to analyze market trends and identify possible points to open/close positions.
Platform where traders earn more

Trade on LiteFinance’s high-tech ECN platform and open an account so that beginner traders can copy you. Earn a commission for copy trading and boost your income.
Interpreting the Advance-Decline Line
The advance/decline line is used to show market sentiment, confirm trend strength, and assess market breadth. When the A/D line rises, this means that ascending stocks prevail, confirming the bullish trend. If the line is declining, this points to bearish sentiment or a weakening uptrend.
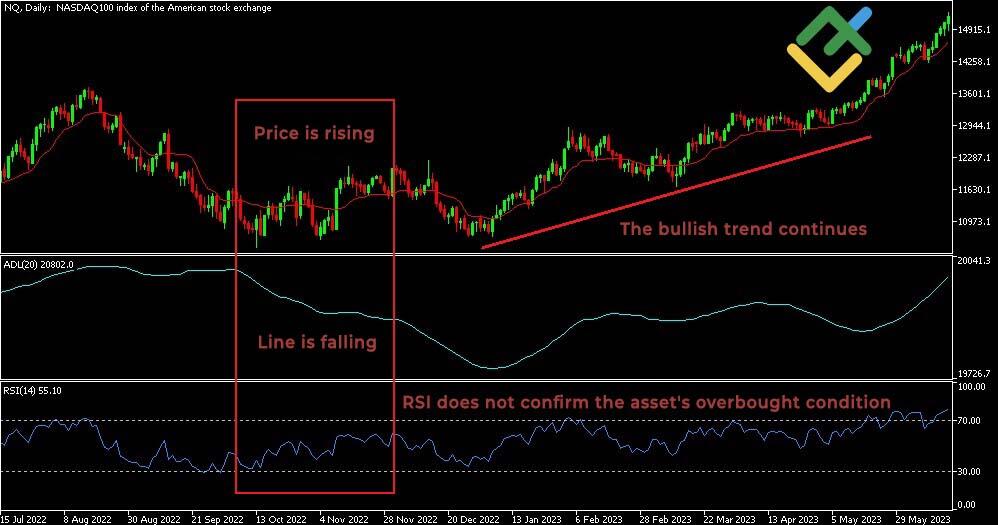
A divergence between the A/D line indicator and the price of an index, such as the S&P 500, indicate a possible trend reversal. For example, if the price of a trading instrument is rising and the line is falling, the bullish trend is weakening. Conversely, when the price is falling, and the line is growing, the bearish trend may reverse.
For more accurate market analysis and trend validation, the A/D line is often combined with other indicators, such as the RSI or MACD.

Scenarios of A/D Line and Index Movements
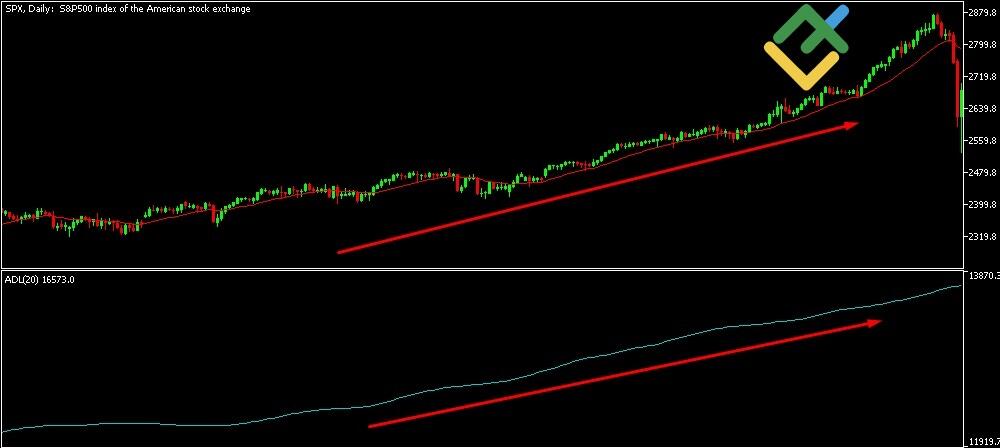
1. The A/D line and the index value are trending upward. If both the index price and the A/D line are rising, this is a signal of a bull market. The majority of stocks are growing, it is possible to consider buy trades due to strengthening of the uptrend.

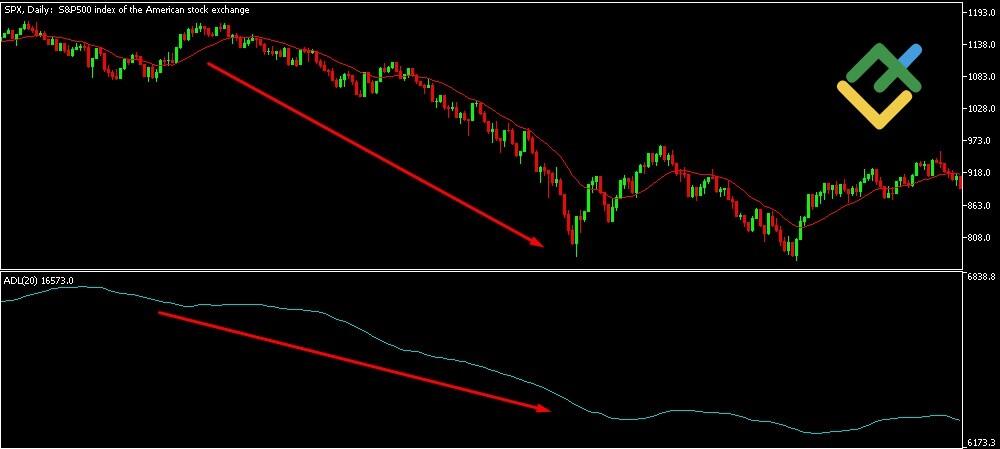
2. The A/D line and the markets are trending downward. If the index price and A/D line are declining, it indicates a bear market. In this case, most securities are falling, which confirms the weakness of the market. Traders can use this signal as a confirmation of a bearish trend and consider short positions.

3. The A/D indicator is trending upward, while the index is moving in the opposite direction. This represents a bullish divergence, assuming that sellers are losing their conviction. The index is declining, but the rising A/D line indicates an increase in the number of rising stocks, suggesting that fewer stocks are declining over time and the downward trend may reverse as more stocks in the index are beginning to rise, thereby the index may be near the end of its decline.


